The Behavioral Signal Hierarchy: Why Search Engines Can't Measure Satisfaction Directly
Search engines cannot measure satisfaction directly. The Behavioral Signal Hierarchy explains the four implicit signal tiers — and why click rates rank lowest.

Berk Nezir Gün
Founder, Behavioral Responsivity Framework
Key Takeaways
- 01
"User satisfaction" is not a single signal. It is a latent construct assembled from multiple behavioral proxies, each carrying different inferential weight.
- 02
The core distinction between explicit and implicit signals explains why survey data fails systematically where interaction logs succeed.
- 03
Signal reliability scales inversely with how easily it can be manufactured — which is why the signals hardest to fake carry the most weight.
- 04
The same signal means different things in different contexts. A long dwell time on a product page indicates interest. A long dwell time on a checkout form indicates confusion.
- 05
Behavioral signals are not processed in isolation. Search engines cross-validate across tiers — which is why optimizing for a single metric is structurally insufficient.
Here is a claim you have probably heard, read, or made yourself: Google's algorithm rewards user satisfaction.
It sounds reasonable. It might even feel obvious.
And it is almost entirely the wrong way to think about how ranking systems work.
The problem is the word "satisfaction." It implies a single, legible thing — something users feel, engines detect, and content can optimize for.
But satisfaction is not a signal. It is an inference.
Search engines cannot observe satisfaction directly, any more than a doctor can observe pain directly. What they can observe is behavior — and which parts of it carry weight is what this article is about.
This builds on the Satisfaction Paradox, examined in Ontology 4 — Utility Divergence: perceived satisfaction and actual utility systematically diverge, and users report satisfaction with results that failed them. That leaves one question open. If behavior tells a more reliable story than self-report, what does the behavioral record actually contain — and why do some signals carry more inferential weight than others?
That is what this article addresses.
After reading this article, you will understand:
- Why the signals your analytics platform exposes are structurally the least reliable ones in the hierarchy — and which to seek instead
- How to read query reformulation as a diagnostic, not a traffic metric
- Why manipulation resistance, not volume, is the correct axis for evaluating signal quality
Behavioral signals are observable user interactions that search engines may interpret as indirect evidence of whether a search result satisfied user intent. Unlike explicit feedback mechanisms such as surveys, ratings, or reaction buttons, behavioral signals are generated through action rather than self-report, making them less susceptible to introspection errors and response bias. Because search engines cannot directly observe a user's internal state, behavioral signals function as proxy indicators from which satisfaction, utility, and relevance may be inferred rather than measured directly.
A well-known example is Google's Navboost system, discussed during the 2023 antitrust trial. Testimony described operational categories such as goodClicks, badClicks, and lastLongestClicks, illustrating how a search engine may interpret interaction data when estimating search success. These are implementation details — illustrations of the concept, not the definition of it.
"User Satisfaction" Is Not a Signal — It Is a Latent Construct
"User satisfaction" is not one thing. It is a latent construct — something you can only infer from observable proxies.
The SEO industry collapses complex systems into single phrases. "Google rewards user satisfaction" does the same work as "Google rewards quality": it sounds instructive but offers no operational guidance, because it names an outcome, not a mechanism.
In information retrieval research, satisfaction is treated as a latent construct — not observed directly, only inferred from proxies. Those proxies are behavioral signals. And once you treat them individually, they stop looking interchangeable: a click is not a six-minute dwell; a reformulation is not a return visit three days later. They belong to different categories, carry different amounts of noise, and require different interpretation.
Behavioral signal taxonomy — classifying these signals by type, source, and inferential reliability — is the foundational layer of any serious account of how ranking systems work.
Without it, every discussion of "signals" stays conceptually vague.
The Two Signal Families: Explicit vs. Implicit
Before the hierarchy comes a more basic split: signals users give, and signals users leak.
Explicit signals are generated intentionally — a star rating, a thumbs up, a survey response, a "Did you find what you were looking for?" prompt. They are cheap to collect, easy to read, and structurally unreliable.
That unreliability is not incidental; it follows from how cognition works. In their foundational study, Nisbett and Wilson (1977) showed that people are remarkably poor at reporting the causes of their own behavior — we construct explanations after the fact, attributing decisions to factors that played no causal role. When a user rates a result, they are not reading an internal register of satisfaction.
They are generating a story.
Scharkow (2016) made the gap concrete. Comparing self-reported internet use against actual client logs, he found self-report and logs correlated at only r = .38 for weekly duration — where a reliable instrument should reach .70 — and r = .29 for frequency. The errors were directional, not random: users over-reported high-status activity (news, education) and under-reported entertainment. They reported the identity they aspired to, not the behavior they performed.
This is why search engines do not rely on explicit feedback. It is not that explicit signals carry no information — it is that they carry the wrong information, skewed by social desirability bias and post-hoc rationalization.
You cannot build a reliable ranking system on a foundation of aspirational self-reporting.
Implicit signals are different in kind. They are produced by behavior, not testimony — a click, a pause, a return, a reformulation, emitted as a byproduct of interaction. Because they require no self-report, they bypass the distortions that make explicit signals unreliable.
Joachims et al. (2005) established the foundational reading in an eye-tracking study: clicks are informative but biased. They carry genuine preference information — users do not click at random — but it is contaminated by position effects, since higher-ranked results draw disproportionate attention regardless of quality. Raw click rates cannot be read as absolute relevance judgments; relative preferences derived from clicks, however, are reasonably accurate.
Analogy: The Witness Stand vs. the Security Footage
A witness testifying about what they saw is providing explicit feedback: motivated, filtering through memory, constructing a narrative. A security camera recording the same scene is providing implicit feedback — it does not interpret, it does not aspire, it captures what happened.
Search engines have access to both. For understanding what actually passed between a user and a result, the footage is more useful — provided you know how to read it.
The Behavioral Signal Hierarchy: Click, Engagement, Reformulation, and Longitudinal
Implicit signals are not equal. They sort into four tiers, ranked by how hard each one is to fake.
Within the Behavioral Responsivity Framework, implicit signals are classified not by their visibility but by their inferential reliability — a distinction that changes what content optimization means. The taxonomy runs from general to specific: behavioral signals split into Explicit and Implicit families, and the Implicit family subdivides into four tiers that differ in what they measure, how much noise they carry, and — crucially — how hard they are to manufacture.
Each tier marks two things at once: where in the search process the signal appears, and how resistant it is to manipulation. Neither is the same as evidence strength — a Tier 3 signal is not more true than a Tier 2 signal, only observed at a different point in the user's trajectory, where the available manipulation tactics differ in kind.
Google is the most visible case study here — because of public patents, testimony, and disclosures — but the hierarchy is platform-agnostic. Any system inferring utility from behavior faces the same constraints, whether a web search engine, a recommendation engine, an answer engine, or an AI retrieval model. Google is the evidence; the constraints are universal.
The four tiers at a glance:
| Tier | Signal | What it measures | Manipulation cost | Primary evidence |
|---|---|---|---|---|
| 1 | Click Signals | Which result the user selects | Low — click farms, CTR manipulation exist | Joachims (2005, 2007) 🟢; US 8,938,463 🟠 |
| 2 | Engagement Signals | What happens after the click — dwell, scroll, lastLongestClicks |
Medium — sustained dwell is hard to fake at scale | US 8,938,463 🟠; 2024 API leak 🔵 |
| 3 | Reformulation Signals | Whether the result resolved the need | High — requires a full, failed session | Microsoft US 20150379074A1 🟠; Joachims (2007) 🟢 |
| 4 | Longitudinal Signals | Whether utility persisted after the task ended | Very high — must produce real recurring value | Pirolli & Card (1999) 🟢; Framework Synthesis 🟣 |
Order reflects inferential reliability and manipulation resistance — not confirmed ranking weight.
This ordering is Goodhart's Law in miniature. The economist Charles Goodhart first stated it in 1975:
Any observed statistical regularity will tend to collapse once pressure is placed upon it for control purposes.
— Charles Goodhart, Problems of Monetary Management: The UK Experience, 1975
In Marilyn Strathern's now-standard compression: when a measure becomes a target, it ceases to be a good measure. A behavioral signal stays honest only until optimizers start aiming at it — and the cheaper it is to aim at, the faster it decays. The Manipulation-Cost Framework is that same law read in reverse: the harder a signal is to target profitably, the longer it keeps measuring what it was meant to measure.
Tier 1 — Click Signals
Click-through rate is the most visible signal — and the noisiest.
CTR is the first signal most SEOs reach for, and within the hierarchy it has the lowest signal-to-noise ratio. Not because clicks carry no information: Joachims et al. (2007) extended the 2005 findings to show that relative preferences from clicks hold not just within a results page but across chains of query reformulations, agreeing with explicit relevance judgments 80.8% of the time — approaching the 89.5% ceiling of agreement between human judges.
The problem is contamination.
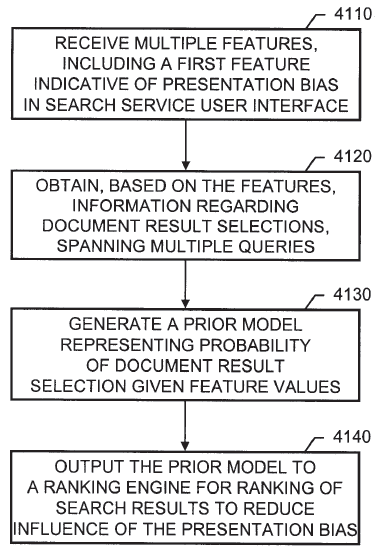
US Patent 8,938,463 (Google, 2015) addresses it directly with a prior model of presentation bias: a statistical baseline for how likely a result is to be selected given its position, title formatting, and other display factors. The ranking engine corrects raw click signals against this prior before using them. In other words, Google does not use raw CTR — it uses bias-corrected CTR, and built a dedicated system to do the correction.
So Tier 1 signals demand the most interpretive work, and they are the most accessible and most manipulated. Click farms exist; CTR manipulation is a documented black-hat practice. The returns on gaming Tier 1 have fallen precisely because systems like US Patent 8,938,463 are built to filter it.
The picture shifts again as the SERP changes. Zero-click searches — queries resolved by featured snippets, knowledge panels, or AI Overviews without a visit to any URL — generate impression data but no traditional Tier 1 click. A result in an AI Overview can shape later behavior without producing the click event Tier 1 requires: the behavioral footprint exists, it simply does not pass through the click layer.
Tier 2 — Engagement Signals
Where clicks measure arrival, engagement signals measure what happens next.
Dwell time — the gap between a click and a return to the SERP — is the primary engagement signal, alongside scroll depth and interaction rate. These are harder to fake at scale: a click farm can manufacture clicks, but manufacturing sustained, genuine-looking dwell across millions of sessions is structurally harder, which is part of why engagement carries more weight.
US Patent 8,938,463 (Google, 2015) handles this by weighting clicks by viewing length rather than treating them as binary:
rather than simply distinguishing long clicks from short clicks, a wider range of click through viewing times can be included in the assessment of result quality, where longer viewing times in the range are given more weight than shorter viewing times.
This is the mechanism behind the long-click / short-click distinction. A long click — the user stayed and did not bounce back — is evidence the result held attention; a short click is evidence of the opposite. Treating it as a continuous variable is more sophisticated than the folk-SEO version.
One clarification settles a long-running confusion. When Google representatives denied that "dwell time" is a ranking signal, they meant a narrow definition: time-on-page as measured by analytics tools.
That metric is not what Google measures internally.
The 2024 Content Warehouse API leak confirmed a different variable: lastLongestClicks (Google Content Warehouse API Leak, 2024), measured at the session level. Across a session involving several results, the result the user dwelled on longest before ending the session entirely receives the strongest positive signal. The competitive unit is not "did the user spend six minutes on this page" but "was this the page they stayed on longest before they stopped searching."
That reframes the question from individual page performance to relative session performance — harder to game, and more meaningful as a utility signal. Even so, what dwell means depends on context — a point the Signal Interpretation Constraints section takes up.
Tier 3 — Reformulation Signals
Query reformulation is the most semantically rich signal in the hierarchy — and one of the hardest to fake.
When a user clicks a result and then returns to the SERP to reword the search, they make an unambiguous statement: the result did not resolve their need. They are back, trying again. Unlike a short click — which might reflect a two-second decision — a reformulation represents a complete cycle of information seeking that ended in failure.
In practice this is called pogo-sticking — the rapid bounce from a result back to the SERP. But pogo-sticking names only the bounce; reformulation signals capture the full session trajectory: which results were visited, in what order, and whether any resolved the search.
Pirolli and Card (1999) explain why it is so informative. Information Foraging Theory holds that people seek information the way foragers seek food: they pursue sources with a high expected rate of gain and abandon a "patch" when the yield drops below a threshold. A reformulation is patch abandonment — the user foraged the results, found the yield too low, and moved on.
This is not ambiguous. The user evaluated what was served and returned it.
US Patent 20150379074A1 (Microsoft, 2015) formalizes this operationally, identifying successful queries from session-level reformulation patterns. The "optimum query" is selected based on:
the largest number of user interactions not followed by a query reformulation, user dwell time on selected target websites, or manual reviews of target websites.
Read that carefully: in a production system, query success is defined as the absence of further reformulation. A query that ended the session without the user returning is a successful query.
The signal that defines success is silence — the absence of dissatisfaction evidence.
Joachims et al. (2007) confirmed that relative preferences from click patterns hold across reformulation chains; in the same study, participants issued 1.9 to 2.2 queries per task. Reformulation is not an edge case — it is the default, and the record those chains leave behind reveals not just what failed but what the user was actually trying to find.
Analogy: The Returned Dish
A diner who eats and leaves is satisfied. A diner who flags down the waiter, returns the plate, and asks for something else is not — no complaint filed, no feedback form, but the behavior is unambiguous. A query reformulation is the same event in a search session: the user evaluated what was served, found it insufficient, and asked for something different. And the absence of reformulation — the diner finishing the meal — is itself the signal.
Tier 4 — Longitudinal Signals
The strongest tier is the one that survives time: behavior that recurs after the original task is over.
Longitudinal signals persist beyond the original session — return visits, brand queries following prior exposure, sustained engagement across time. They do not measure whether a result resolved a momentary need; they measure whether it stayed useful after the task ended. They are also the most resistant to manipulation: a return visit requires a user to seek out the same source again days, weeks, or months later, which is hard to manufacture at scale without producing the utility that motivates the return.
Behavioral Foundation
Information Foraging Theory (Pirolli & Card, 1999) predicts that users return, repeatedly, to sources that previously delivered high yield. A return visit therefore functions as revealed preference rather than stated preference — the user is not reporting satisfaction, they are expressing it through repeated action. And since Nisbett and Wilson (1977) established that people are often poor at explaining their own behavior, longitudinal signals sidestep that limitation entirely: the user is demonstrating a preference under real conditions, with no experimental pressure and no audience.
Framework Synthesis
Tier 4 has the least direct public evidence of implementation, but the strongest theoretical justification within the framework. The mechanisms by which longitudinal signals influence ranking are not publicly documented with the precision of Tier 1 and Tier 2, so its place at the top rests on behavioral theory and manipulation-cost logic. The claim is therefore theoretical rather than implementation-specific: the Manipulation-Cost Framework predicts that signals stable across sessions should carry greater inferential weight than signals generated within a single interaction, because they are harder to manipulate and more likely to reflect durable utility.
Behavior that survives time is behavior that is hard to fake — and therefore unusually informative.
The Manipulation-Cost Framework: Why Reliability Scales With Manufacturing Difficulty
The Goodhart bridge named the principle; the Manipulation-Cost Framework is its operational form — signal reliability modeled as a function of one variable: the cost of manufacturing a signal at scale. Reliability scales inversely with that cost — which is why the signal a user generates days after their search carries more inferential authority than the one they generate in the first two seconds.
Navboost — Google's click-based ranking system, confirmed in testimony during the US v. Google antitrust trial (2023) — shows a production system handling exactly this. Google's Eric Lehman described the relationship in court:
Because Clicks are an important signal in ranking... we have people read the search results and the query and everything else on the page and then we observe their reactions, and those observations are Clicks.
— Eric Lehman, Google Search Senior Research Scientist, United States v. Google LLC, September 2023
Lehman also described how Navboost calibrates to the data available: stronger score modifications for queries seen many times, gentler adjustments for sparse long-tail queries. The system is designed around the confidence interval of the evidence, not just its direction. A handful of manipulated sessions is easy to manufacture; millions of consistent, coherent patterns across a query's full history are not.
That is not a coincidence. That is the design.
Signal Interpretation Constraints
The same signal can mean opposite things. Context decides which.
Raw signals require interpretation, and interpretation requires context. Dwell time on a recipe page is high and intent resolution is high — users read, leave the tab open while cooking, return. The same duration on a technical support page may mean the user is stuck. Identical Tier 2 signals, opposite implications. Reformulation on a navigational query differs from reformulation on an informational one: a user who can't recall a familiar URL reformulates the instant they hit the wrong result — not because the content was poor, but because the destination was wrong.
This is not a flaw in the hierarchy. It is why Ontology 3 — Adaptive Feedback Systems exists: search engines apply contextual normalization before signals influence ranking, adjusting for device, query category, geographic baseline, and temporal pattern. The hierarchy describes what is collected; normalization describes how it is cleaned.
Chapelle and Zhang (2009) formalized this in their dynamic Bayesian network click model, treating user examination and user satisfaction as separate probabilistic variables — because a user who did not click may have judged the result irrelevant, or may simply never have examined it. The two look identical in raw click data; separating them requires modeling examination probability, which varies with position, presentation, and query type.
So signals are not additive. You cannot sum a CTR score, a dwell score, and a reformulation score into one satisfaction index — they interact, overlap, and contradict each other in ways that require system-level interpretation. Instead the tiers cross-validate: a Tier 3 reformulation recolors what a Tier 2 dwell meant, and engines infer quality probabilistically from the whole pattern, not any single number.
Three Common Misinterpretations: Bounce Rate, CTR, and Dwell Time
The hierarchy is often misrepresented — not because the claims are wrong, but because they are imprecisely framed. Three misreadings are common enough to correct.
"Google uses bounce rate as a ranking signal"
Not exactly. Bounce rate is a session-level metric your analytics tool calculates; Google has never confirmed reading it. What Google measures, via Navboost, are patterns that partly overlap with it — short sessions followed by a return to the SERP, absence of further engagement, subsequent reformulation. The behavior is real; the dashboard metric is not what is read. Optimizing the number without fixing the behavior is optimizing the instrument, not the condition. Bounce rate is a noisy proxy for that signal, not a substitute for it.
"CTR is a ranking factor"
Oversimplified. Raw CTR is not a ranking input; bias-corrected CTR — adjusted against a prior model of presentation bias — is a component of Tier 1, as US Patent 8,938,463 details. A page that gains clicks by moving from position 4 to position 2 has not shown more preference; it has benefited from position. Campaigns that boost raw CTR without improving content work against that distinction.
"Long dwell time proves user satisfaction"
Context-dependent. As the Signal Interpretation Constraints section showed, long dwell on a checkout page most likely signals confusion, not satisfaction. What matters is dwell relative to query intent, page type, and subsequent behavior. Length only matters in context.
Framework Application: If the Hierarchy Is Correct, Then…
This section is Framework Synthesis: a set of diagnostics the hierarchy implies, not a tested playbook with guaranteed outcomes. The catch is structural — the signals search engines weigh most are the ones you can see least. So the work is reading honest proxies, with their limits stated, rather than chasing a dashboard number.
Your tools expose far less than Google does. Search Console reports impressions, clicks, CTR, and average position. GA4 reports engagement time, scroll, and returning-user rate. Neither exposes query reformulation chains or Google's session-level signals. So each tier below pairs a visible proxy with the thing it cannot tell you — and the question worth asking because of that gap.
| Signal tier | What you can see (your tools) | What it can't tell you | Audit question |
|---|---|---|---|
| 1 — Click | GSC: CTR and average position, per query | Raw CTR is confounded by position; Google's bias correction is invisible to you | Is CTR low for this position — a title or snippet problem — or just normal for the rank? |
| 2 — Engagement | GA4: average engagement time, scroll depth | High dwell can mean interest or friction; meaning depends on the page's intent | Is the dwell on this page appropriate to its intent, or a sign of confusion? |
| 3 — Reformulation | Indirect only: a page that earns clicks (GSC) but logs very short sessions (GA4) | You cannot see the reformulation itself; that record lives with Google | When the click is earned but the session is short, is the intent actually being resolved? |
| 4 — Longitudinal | GA4: returning-user rate and direct-traffic trend; GSC: branded-query growth over time | These are publisher-side shadows, not Google's internal longitudinal signal | Does this page — or the brand — earn return visits and branded demand, or only first clicks? |
↓ Top to bottom, manipulation cost rises — and with it, how far the signal can be trusted.
What the framework would have you do:
- Prioritize pages and topics by their higher-tier proxies — returning-visitor and branded-search growth — rather than by raw click volume.
- Before counting a page as a success, confirm the gain shows up in a proxy above Tier 1. A click-only win is the easiest kind to manufacture.
- When two proxies disagree, trust the one that is harder to fake — the Manipulation-Cost logic, turned on your own dashboard.
- Treat no single proxy as decision-grade. Act when two or three point the same way.
Intent-Dependent Decision Rules
Read each as a hypothesis to test against the page's intent — not a verdict:
- High CTR + low engagement → likely a snippet or intent mismatch: the title earned the click, the page did not resolve the need. (On a deliberately quick-answer page, the same pattern can be success — confirm the intent first.)
- High engagement + no return visits → the page delivered once but built no lasting utility. Expected for one-off transactional intent; a warning sign for content meant to compound.
- Rising return visits + rising branded search → longitudinal utility is likely improving — the hardest-to-fake pattern you can observe.
These are not traffic problems. They are alignment problems. The signals and the substance are the same thing.
This taxonomy frames what engines measure. How they decide what a given query deserves — why the same signal carries different weight for a navigational query than an informational one — is the work of the next installment, Ontology 2 — Intent-Response Alignment.
Evidence Classification: 🟢Established Research · 🟠Patent Evidence · 🔵Production Evidence · 🟣Framework Synthesis
Key Academic Sources
- 🟢 Clickthrough data and implicit feedback — Joachims et al., 2005
- 🟢 Click accuracy across query reformulation chains — Joachims et al., 2007
- 🟢 Self-report accuracy vs. behavioral log data — Scharkow, 2016
- 🟢 Limits of introspection on cognitive processes — Nisbett & Wilson, 1977
- 🟢 Information foraging and patch abandonment theory — Pirolli & Card, 1999
- 🟢 Examination probability and click model bias correction — Chapelle & Zhang, 2009
- 🟢 Goodhart's Law — measures that become targets stop measuring well (Goodhart, 1975; popularized by Strathern, 1997)
Patents & Production Evidence
- 🟠 US Patent 8,938,463 — Presentation bias correction and implicit user feedback (Google, 2015)
- 🟠 US Patent 20150379074A1 — Query reformulation and search success identification (Microsoft, 2015)
- 🔵 Eric Lehman, Google Search Senior Research Scientist — Testimony, United States v. Google LLC, September 2023
- 🔵 Google Content Warehouse API Documentation Leak — Navboost signal categories, May 2024