
Why Users Rate Poor Search Results Highly: The Satisfaction Paradox in SEO
Users are terrible judges of what actually satisfies them. Here is why that changes everything about how SEO should be evaluated.

Berk Nezir Gün
Founder, Behavioral Responsivity Framework
Key Takeaways
- 01
Users report high satisfaction with search results even when those results are suboptimal — a phenomenon called the Satisfaction Paradox.
- 02
Position bias causes users to click top results regardless of quality. Being #1 creates a mental shortcut that overrides critical judgment.
- 03
Search engines cannot trust what users say. They track what users do — dwell time, SERP returns, query reformulations — to infer true satisfaction.
- 04
US Patent 8,938,463 exists to turn raw click behavior into a cleaner relevance signal: it models how likely a result is to be clicked from its position alone, then corrects real clicks against that baseline before they reach the ranking. A companion patent (US 9,002,867) discounts accumulated behavioral data once a page substantially changes.
- 05
Optimizing for clicks or survey scores without correcting for cognitive bias leads to false positives and misallocation of SEO effort.
Google publicly frames its ranking systems around user satisfaction.
Every algorithm update, every ranking factor adjustment, every quality guideline exists to ensure users find what they're looking for. If your content satisfies users, you rank. It's the fundamental logic of modern search.
But here is the uncomfortable truth: Users are terrible judges of what actually satisfies them.
The Satisfaction Paradox in SEO is the phenomenon where users report high satisfaction with search results despite those results being suboptimal, due to cognitive biases like position bias and post-hoc rationalization.
If you rely solely on what users say they want — or how they rate content in surveys — you may be optimizing against a distorted proxy rather than actual user behavior.
Within the Behavioral Responsivity Framework, the Satisfaction Paradox is the entry point to Utility Divergence (Ontology 4) — the systematic gap between the satisfaction a user perceives and the utility a result actually delivers.
It also explains why the framework begins with behavior rather than opinion: the divergence itself is the reason stated preference can't be taken at face value.
After reading this article, you'll understand three things that materially change how SEO should be evaluated and executed:
- Why high user satisfaction scores and positive feedback often correlate with mediocre or even misleading search results
- Why modern search systems increasingly trust behavioral patterns over explicit user feedback when validating relevance
- Why optimizing for clicks, ratings, or surveys without correcting for cognitive bias leads to false positives and strategic misallocation of effort
The Satisfaction Paradox: When "Good" Isn't Good Enough
The Satisfaction Paradox describes a specific cognitive dissonance in Information Retrieval: users frequently rate search results as highly relevant, even when those results fail to provide the best answer.
This isn't just a theory — it is a measurable phenomenon documented in foundational search studies.
Back in 2009, a team of researchers (Guo et al.) studied 8.8 million real search sessions to answer a simple question: do people click on results because they're relevant — or just because they're at the top?
They used a Bayesian model to separate two things:
- Did the user even see the result?
- Did they click it after seeing it?
The finding? Position matters — a lot.
Even when a lower-ranked page is just as good (or better), users overwhelmingly click the top results.
- The #1 result gets clicked about 30% of the time
- By #10, that drops to just ~3% — a 10-fold decrease
In plain terms: rank isn't just a side effect of quality — it drives attention and clicks, all on its own.
The model even puts a number on it: drop position from the calculation and prediction accuracy falls by nearly 10%.
Analogy: The "Empty Restaurant" Syndrome
Imagine you're walking down a street looking for dinner. You see two restaurants. Restaurant A has a line out the door. Restaurant B is empty. You instinctively join the line for Restaurant A.
After waiting 45 minutes, you finally eat. The food is average — perhaps a 6/10. But when your friend asks how it was, you say, "It was great! We had to wait forever to get in."
Why? Because admitting the food was average would mean admitting you wasted 45 minutes. This is Post-Hoc Rationalization — your brain rewrites the narrative to justify your investment.
In SEO, the "line out the door" is a high ranking. Users click the top result, and even if the content is mediocre, their System 1 thinking convinces them it must be good because the search engine ranked it there.
In a 2007 experiment, Pan and colleagues tested whether people truly judge search results by quality — or whether the top position itself tricks the brain. They showed users a list of scientific abstracts but randomized the rankings. The result:
- When users read the abstracts: position still edged out relevance as a predictor of clicks (F = 12.32 vs. 12.22)
- When users just saw them: position was 24 times more influential than relevance (F = 137.38 vs. 5.75, both p < 0.01)
Most strikingly: even when users knew the rankings were randomized, they still favored the top result.
Being #1 isn't just about visibility — it creates a mental shortcut. Our brains treat "top spot" as a signal of trustworthiness, even when we're aware it's arbitrary.
A controlled study across three search engines confirmed this independently. Bar-Ilan et al. (2009) showed that in 75% of cases, users selected their "best" result from the top-three positions — regardless of whether results appeared in the engine's original order or an artificially reshuffled version. The authors also found a "site reputation bias" compounding position bias: well-known sources like Wikipedia were chosen favorably even when ranked mid-page. Placement and brand recognition together override content quality in the user's initial judgment.
The Cognitive Engine: System 1 vs. System 2 in Search
To understand why the Satisfaction Paradox exists, we must examine the machinery of the human mind. The two-mode account of cognition — the labels System 1 and System 2 — was introduced by Stanovich & West (2000) and later popularized in Daniel Kahneman's Thinking, Fast and Slow (2011).
The two modes are:
- System 1: Fast, automatic, emotional, and subconscious
- System 2: Slow, effortful, logical, and conscious
The "Cognitive Miser" in the SERPs
When a user types a query into Google, they operate almost entirely in System 1 — scanning for patterns, familiar keywords, and visual cues, seeking cognitive ease.
Experimental work shows that most people default to fast, intuitive judgments and only sometimes engage effortful reasoning, even when accuracy matters. We are "cognitive misers" (Stanovich & West, 2000), conserving mental energy whenever possible.
Eye-tracking research supports this. Buscher et al. (2009) found that users allocate only a few seconds before fixating on key regions of a page, with many areas receiving no meaningful attention. Users don't read search results — they scan for salient visual features.
If a result looks professional and uses the right keywords, users will often click without engaging System 2 to verify facts. This is why clickbait works initially but often fails the subsequent utility test.
The Anchoring Effect
The Anchoring Effect (Tversky & Kahneman, 1974) compounds position bias. Even if result #4 is objectively better, users perceive it as less authoritative simply because it appears lower.
This creates a self-reinforcing cycle: the anchor sets expectations, and users then judge all subsequent results against that initial reference point. When the top results fail, users rarely blame the search engine. They assume the problem lies with them.
Seen through a behavioral lens, SERP interaction splits cleanly into two cognitive modes — each leaving a different behavioral fingerprint:
| Cognitive Mode | SERP Interaction | Dominant Bias | Behavioral Signal |
|---|---|---|---|
| System 1 (Fast) | Scan → click #1 | Position Bias | High CTR, variable dwell |
| System 1 (Fast) | Click clickbait | Emotional Trigger | High CTR, low dwell |
| System 2 (Slow) | Read carefully | Confirmation Bias | Lower CTR, high dwell |
| System 2 (Slow) | Deep consumption | Utility Focus | Sustained engagement |
This is why CTR alone fails to capture true satisfaction. System 1 clicks generate visibility; System 2 engagement generates algorithmic confidence.
The Measurement Gap: Self-Report vs. Behavioral Data
If users are biased, can't we just ask them what they want?
Unfortunately, no. This creates the Measurement Gap — a massive divergence between what users say (Self-Report) and what they do (Behavioral Data).
In the Behavioral Responsivity Framework, that divide has names. Explicit Signals are what users state on purpose — ratings, surveys, thumbs up or down. Implicit Signals are what they emit by acting — clicks, dwell, reformulations, return visits. Self-Report is the explicit channel; Behavioral Data is the implicit one.
Everything that follows is an argument for trusting the second channel over the first.
Nisbett and Wilson (1977) demonstrated that people are remarkably bad at introspecting on their own cognitive processes. Subjects couldn't accurately report which factors influenced their decisions, often relying on plausible but incorrect explanations.
This extends to digital behavior. Scharkow (2016) compared self-reported internet use against actual client logs and found stark discrepancies: users significantly over-reported general internet use and under-reported visiting video platforms.
At first glance, behavioral data appears to offer a solution. However, Hassan et al. (2013) found that simple per-click metrics are often noisy and poor proxies for success. Their research showed that session-level features — such as query reformulations — are far more accurate predictors of satisfaction than click-only baselines, allowing systems to filter out misleading signals.
Google's Public Framing vs. Behavioral Reality
That public framing collides with an operational constraint: search systems cannot rely on satisfaction as users report it. And even the behavioral signals they turn to instead — clicks — cannot be used as raw input:
Using clicks directly in ranking doesn't make too much sense because of the noise.
— Gary Illyes, Google Webmaster Trends Analyst, SMX Advanced 2015
Analogy: The "Gym Membership" Effect
Think of user metrics like a gym membership.
- Self-Report: Someone says they exercise three to four times a week
- Behavioral Data: The turnstile shows they swiped once last month
If you optimize based on what users say, you might be building a gym no one visits. You need to look at the turnstile.
Intent-Dependent Success: "Satisfied" Depends on the Query
The Satisfaction Paradox doesn't manifest uniformly. What counts as satisfaction depends entirely on user intent.
Rose & Levinson (2004) classified search goals into distinct categories: approximately 61-62% of queries are informational, 13-14% navigational, and 24-25% transactional. Later large-scale studies by Jansen et al. (2008) found an even higher prevalence of informational queries — over 80%. Because satisfaction looks fundamentally different across these segments, ranking factors cannot be one-size-fits-all.
Navigational intent ("Login page"): Success means short dwell time with no SERP return. If someone spends 5 minutes on a login page, something is wrong.
Informational intent ("B2B Software Comparison"): Success means long dwell time, multiple page views, and return visits. A user visiting 5 times over two weeks isn't showing uncertainty — it's healthy consideration-phase behavior.
The pattern generalizes by business model. In B2B/SaaS contexts (informational intent), satisfaction can look like a ten-minute read spread across several sessions. In local search (navigational intent), it can look like a ten-second visit followed by a tap on directions or a phone number.
Same behavior, opposite meaning. A single signal can never be read without its intent context. The framework calls this match between query intent and the behavior a result earns Intent-Response Alignment — the subject of Ontology 2 — and the Behavioral Responsivity Framework treats it as a weighting problem: the algorithm must adjust how much each signal counts based on the intent behind the query.
Behavioral Responsivity: The Algorithm as a Truth Detector
Search engines have realized that human feedback is flawed. To solve this, they increasingly rely on Implicit Behavioral Validation.
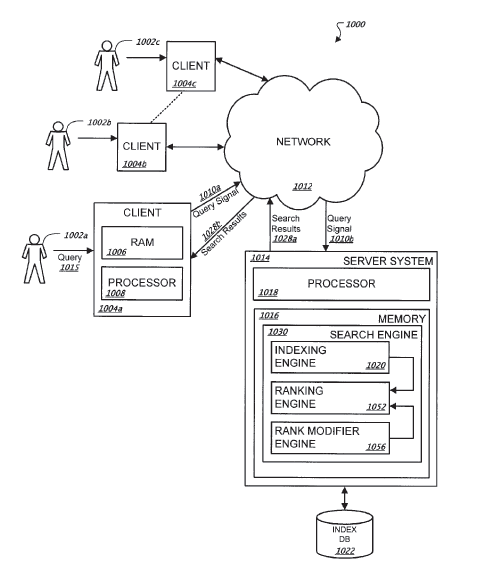
Joachims et al. (2005) showed that search engines must correct for position bias to extract true relevance signals from behavioral data. Accordingly, Google has described a rank modifier engine (US Patent 8,938,463) designed to reduce the effects of presentation bias before behavioral signals influence rankings. A companion patent describes those signals being weighted against specific document versions — when content changes significantly, prior behavioral data is discounted proportionally (US Patent 9,002,867). Whether both are active in production is not publicly confirmed — but the design intent is explicit.
The same patent is unusually specific about what counts. Rather than treating every click as one unit of approval, it sorts them by how long the visit lasted and gives each category its own weight — a short click treated as evidence against the page, a medium click as weak support, a long click as strong support, and a last click, the final selection in a session, weighted separately again. The direction of the design is the point: a click on its own is not read as satisfaction, and a fast return to the results page is read as the opposite.
Kelly & Teevan (2003) catalogued early evidence that dwell time, scrolling, and revisits can each characterize user interest — while cautioning that any one of them, read alone, is noisy, since display time is not the same as active attention.
The key questions algorithms now track:
- Did they return to the SERP? (Dissatisfaction)
- Did they reformulate the query? (Confusion)
- Did they engage deeply? (Utility)
This is Revealed Preference. In economics, preferences are revealed by purchasing habits. In SEO, preferences are revealed by interaction habits.
The idea is older than search itself. Samuelson (1938) proposed dropping stated preference from consumer theory entirely: what people want is inferred from what they choose under real constraints, not from what they report wanting. Search engines arrived at the same conclusion nine decades later — with better data.
Those three questions are not a flat checklist. They map to the four tiers of the Behavioral Signal Hierarchy: Click Signals, Engagement Signals, Reformulation Signals, and Longitudinal Signals.
What sets the order is the Manipulation-Cost Framework: a signal carries more inferential weight the harder it is to manufacture at scale — a survey response is trivial to fake, a return visit three weeks later is not. (The ranking weight engines actually assign each tier is a separate, unconfirmed question.) We develop the full structure in The Behavioral Signal Hierarchy, the foundational article of Ontology 1 — User Behavior Signal Architecture.
Aslanyan & Porwal (2019) note that early approaches used intervention experiments — randomly swapping result rankings to measure click propensities — but these degrade user experience. Modern search engines now use unbiased learning-to-rank methods that estimate position bias from regular click data, without disrupting what users see. This allows continuous correction for position bias while maintaining search quality.
Bridging the Gap
What emerges is a simple reality: good SEO matches content experience to System 1 expectations while delivering enough System 2 value to prevent a bounce.
When you internalize the Satisfaction Paradox, you stop optimizing for what users say and start stating Behavioral Success Hypotheses — explicit, written-in-advance rules about what behavior should look like if the need were actually met. The discipline is in writing the rule before you read the data, and in keeping the rule a hypothesis until something independent confirms it. Aggregate interaction patterns are the evidence you check it against; they are not the verdict.
You stop writing for the user who says they want a 5,000-word whitepaper, and start designing for the user who demonstrates they need a 30-second answer.
Framework Application: If the Paradox Is Real, Then…
This section is Framework Synthesis: diagnostics and decision rules the Satisfaction Paradox implies, not a tested playbook with guaranteed outcomes. It is the operational layer of Utility Divergence — the move from what is happening to what to check, and what to conclude.
The paradox creates a measurement trap. The side you can see most easily — rankings, click-through rate, the occasional survey score — is the perceived side. The side that reveals actual utility — sustained engagement, return visits, branded demand — is harder to see and slower to arrive. Optimize only what is easy to measure, and you optimize the perception, not the utility.
Which proxy shows what, and what each one cannot tell you, is set out once in Reading your own signals — including the explicit-feedback row that matters most for this article, since surveys are the channel the paradox distorts.
The rule that follows for the paradox specifically: when a stated measure and a behavioral one disagree, the behavioral one is the harder of the two to manufacture. That is not proof it is right. It is the reason to weight it more.
Intent-Dependent Decision Rules
Read each as a hypothesis to test against the page's intent — not a verdict. One limit applies to all of them: position bias is a property of the results page and is corrected inside the engine, so you cannot diagnose it from your own analytics. What you can detect is a gap between what the listing promised and what the page delivered. Position bias is one explanation for that gap; a misleading title and a mismatched intent are two others, and your data cannot separate them.
- High ranking + high CTR + low engagement → the click was earned by the listing, not settled by the page. Placement, an overpromising title, and a wrong-intent match all produce this pattern, and telling them apart takes a deliberate change and a re-measurement, not a dashboard. (On a deliberately quick-answer page, low engagement can be success — confirm the intent first.)
- High survey or feedback scores + weak behavioral signals → a live Satisfaction Paradox: stated satisfaction is diverging from revealed preference. Trust the behavior.
- High engagement + no return visits → utility was real but momentary. Expected for one-off transactional intent; a warning sign for content meant to compound.
- Rising return visits + rising branded search → utility is genuinely improving — revealed preference, the hardest pattern to fake.
Which proxies you weight shifts by business model — return-visit rate and multi-session reading for B2B/SaaS; conversion micro-events and session depth for e-commerce and local.
The paradox closes the moment you stop scoring perception and start reading behavior.
A caution as you apply this: these proxies are not direct ranking boosts — they are how engines train and evaluate, the subject of Ontology 3 — Adaptive Feedback Systems. And how an engine decides what a query deserves in the first place is the work of Intent-Response Alignment, where the rest of this cluster goes next.
Evidence Classification:🟢Established Research · 🟠Patent Evidence · 🔵Production Evidence · 🟣Framework Synthesis
Key Academic Sources
- 🟢 8.8M session analysis — Guo et al., 2009
- 🟢 Position bias experiments — Pan et al., 2007
- 🟢 System 1 / System 2 origin and cognitive-miser account — Stanovich & West, 2000
- 🟢 Eye-tracking and visual attention — Buscher et al., 2009
- 🟢 Anchoring effect and heuristics — Tversky & Kahneman, 1974
- 🟢 Limits of introspection — Nisbett & Wilson, 1977
- 🟢 Self-report accuracy studies — Scharkow, 2016
- 🟢 Session-level satisfaction metrics — Hassan et al., 2013
- 🟢 Search intent classification — Rose & Levinson, 2004
- 🟢 Search intent statistics — Jansen et al., 2008
- 🟢 Clickthrough data and trust bias — Joachims et al., 2005
- 🟢 Presentation bias in search result preferences — Bar-Ilan et al., 2009
- 🟢 Implicit feedback signals — Kelly & Teevan, 2003
- 🟢 Revealed preference, original formulation — Samuelson, 1938
- 🟢 Unbiased learning-to-rank methods — Aslanyan & Porwal, 2019
Patents & Production Evidence
- 🟠 US Patent 9,002,867 — Modifying ranking data based on document changes
- 🟠 US Patent 8,938,463 — Modifying search result ranking based on implicit user feedback and a model of presentation bias
- 🔵 Gary Illyes, Google Webmaster Trends Analyst — AMA with Google Search, SMX Advanced 2015
Further Reading
- Thinking, Fast and Slow — Daniel Kahneman, 2011. The accessible synthesis that popularized the System 1 / System 2 framing this article uses. A trade book built on decades of peer-reviewed research — authoritative, but not itself a peer-reviewed study, which is why it sits here rather than under Established Research. Publisher page